Goodreads API
It’s December 23rd and I’ve only read 49 books. Whoops. There’s still time, but it’s definitely getting dicey. I’m about halfway through three books right now so I think I’ll be able to pull it off. Fingers crossed.
Of course, last year I did 52 books in 52 weeks and remember sitting pretty just before Christmas.
As I’ve been logging all my activity on Goodreads I thought it would be neat to plug into the API and compare my reading progress between the years. To see if I read at the same pace and whether there’s some sort of seasonality in my reading habits.
If you happen to use Goodreads and want to do the same here’s how I did it:
Setup
(Man, I love Hadley)
# load packages
library(httr)
library(tidyverse)
library(stringr)
library(xml2)
library(viridis)
library(knitr)

# knitr options
opts_chunk$set(cache = TRUE, warning = FALSE, message = FALSE)
API Guide
I’ve censored my API_KEY and GR_ID but if you replace the "XXXXXXXXXXXXX"s with your KEY and your ID you should be good to go!
# API_KEY <- "XXXXXXXXXXXXX"
# GR_ID   <- "XXXXXXXXXXXXX"

URL <- "https://www.goodreads.com/review/list?"
Get Shelf
This is where the heavy lifting GETs done. I’m leaning on httr and XML2 to parse the API responses.
get_shelf <- function(GR_ID) {
    shelf <- GET(URL, query = list(
        v = 2, key = API_KEY, id = GR_ID, shelf = "read", per_page = 200))
    shelf_contents <- content(shelf, as = "parsed")
    return(shelf_contents)
}

shelf <- get_shelf(GR_ID)

get_df <- function(shelf) {

    title <- shelf %>%
        xml_find_all("//title") %>%
        xml_text()

    rating <- shelf %>%
        xml_find_all("//rating") %>%
        xml_text()

    added <- shelf %>%
        xml_find_all("//date_added") %>%
        xml_text()

    started <- shelf %>%
        xml_find_all("//started_at") %>%
        xml_text()

    read <- shelf %>%
        xml_find_all("//read_at") %>%
        xml_text()

    df <- tibble(
        title, rating, added, started, read)

    return(df)
}

df <- get_df(shelf)
Clean
After getting the XML data into my IDE I tabled and cleaned the data with dplyr and tidyr.
get_books <- function(df) {

    books <- df %>%
        gather(date_type, date, -title, -rating) %>%
        separate(date,
            into = c("weekday", "month", "day", "time", "zone", "year"),
            sep = "\\s", fill = "right") %>%
        mutate(date = str_c(year, "-", month, "-", day)) %>%
        select(title, rating, date_type, date) %>%
        mutate(date = as.Date(date, format = "%Y-%b-%d")) %>%
        spread(date_type, date) %>%
        mutate(title = str_replace(title, "\\:.*$|\\(.*$|\\-.*$", "")) %>%
        mutate(started = ifelse(
            is.na(started), as.character(added), as.character(started))) %>%
        mutate(started = as.Date(started)) %>%
        mutate(rating = as.integer(rating))

    return(books)
}

books <- get_books(df)
Compare
All of that get to this graph:
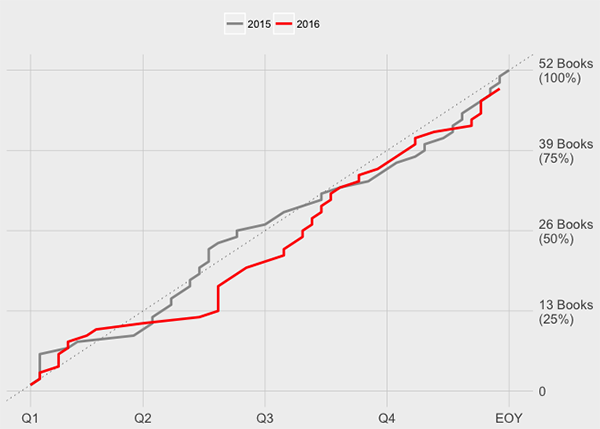
It’s funny to see that I started strong in both years and fell off sometime around March. Though I recovered somewhat in 2015, Spring 2016 was a bad season for reading, apparently.
Looks like I was finished 52 books by December 21st last year. Whoops. Oh well, I still think I can mad rush it to the finish line.